-In your IDS account locate the report you want the graphs for.
-Click the name of the respondent.
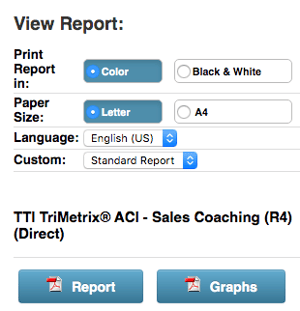
-Click on the button marked "Graphs" to open a document of only the graphs within the report.
-Save the PDF, then you may print it or email it as you feel appropriate.
If you have any questions, or if something does not work, please reach out to our Partner Support Team member by clicking the chat button in the lower right corner, or call us at (800) 869-6908. We will be happy to help.