The horizontal behavioral continuum is a new view of DISC. While the traditional vertical graph requires two graphs for Natural and Adapted scores, the horizontal DISC continuum includes both scores, new descriptors for increased understanding, and “P and C” words to help describe the continuum. The most exciting part of this new continuum is the elimination of high and low scores. Instead of an individual being a “low D”, for example, you now have the language and tools to explain that they are somewhat Reflective when it comes to Problems and Challenges.
Below is an example of the new continuum from one of our sample reports. This article will refer to this example, however the information will apply to any report. We kept the four colors of DISC for the continuum so you can quickly identify where the scores come from.
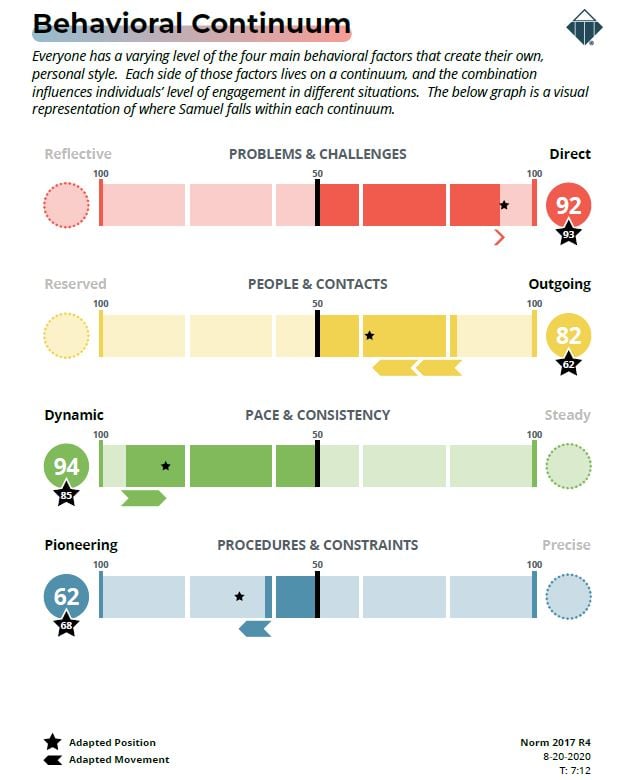
How do I read this graph?
In the circles at the end of each continuum is the respondent's Natural score. To relate this to the vertical style graph, the scores on the right would have been above the line, where scores on the left would have been below the line.
Where is the adapted graph?
With the continuum, both scores are shown at the same time. The star below the Natural score has the Adapted score for that continuum. Additionally, there is a star on the continuum to indicate where their adapted score is in relation to the Natural. Below the bar, there are arrow(s) that indicate the direction of the change and the distance, with each full arrow representing 10 points of movement.
Why does it start at 50 and go to 100 on each continuum?
We wanted to keep some consistency between the standard DISC and our continuum. As a score of 50 has been the inflection point in the past we will continue to use it in that manner.
If you wanted to see how it matches with the vertical style, if the score is in the circle on the left, just subtract that score from 100 to get the score that would appear on a vertical graph.
If you have any questions, or if something does not work, please reach out to our Partner Support Team member by clicking the chat button in the lower right corner, or call us at (800) 869-6908. We will be happy to help.